

is the spread between the lowest and highest published 2026 figure for cost per signed case — $69.99 at one end, $11,500 at the other, both presented as the same metric.
Sources: Mass Tort Ad Agency CPL Benchmarks (Sept. 2026); Mass Tort Marketing Agency CPR Benchmarks (Q1 2026)
Key takeaways
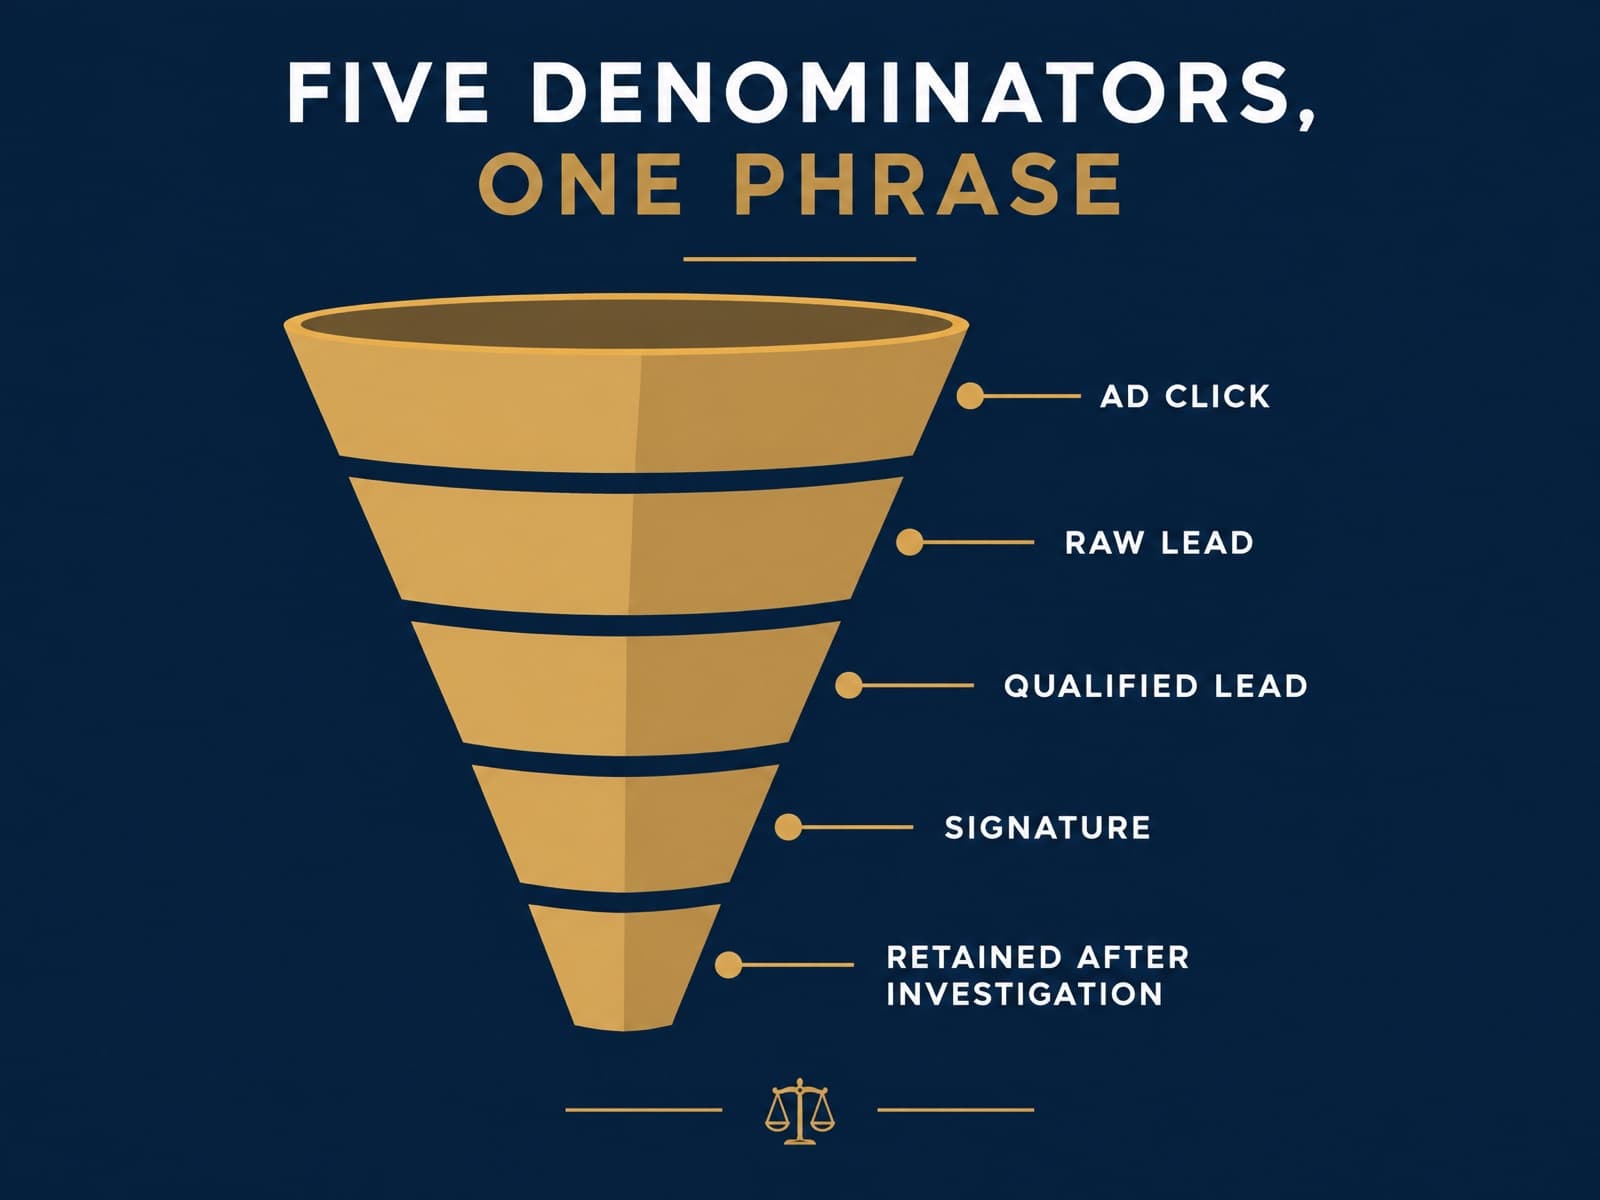
- →5 denominators are published under the single phrase “conversion rate” or “signed case”: ad click, raw lead, qualified lead, signature, and retained-after-investigation.
- →2 of 5 published benchmark pages disclose a sample size or method. The other three state figures with no sourcing at all.
- →277x is the spread inside one publisher’s own internally consistent numbers — $11 for Suboxone to $3,050 for Depo-Provera — which is tort mix alone, before definitions matter.
- →5.45% is published as a personal injury “conversion rate” in the same table as lead-to-client rates, despite almost certainly measuring ad clicks to leads.
- →0 benchmarks use the denominator practitioners argue is the only meaningful one in medical malpractice: cost per case retained after investigation.
- →0 replies is what the clearest public request for real benchmark numbers received on r/Legalmarketing in July 2026.
In July 2026 someone running growth for a personal injury firm posted four precise questions to r/Legalmarketing: what is a realistic cost per qualified lead, what is a realistic cost per signed retainer, what is the real cost per case after post-signing drop-off, and what actually drives signed cases. He said plainly that he wanted real numbers “rather than going off industry-average blog posts”, and offered to compile and publish whatever he heard.
He got no substantive answers. Meanwhile a search for those same questions returns a dozen confident, mutually contradictory numbers. This article reconciles them.
1The published figures, on one axis
Plotted together, the published 2026 cost figures do not cluster. They span three orders of magnitude, which is not a margin of error — it is a sign that the numbers are measuring different things.
Published 2026 figures, log scale
The reflex is to assume someone is inflating or lowballing. That is not what the evidence shows. Two of these sources disclose detailed methodology and both appear to be reporting their own data accurately. The problem is that they are counting different events.
2Five denominators, one phrase
A “signed case” is not a single event. Between an ad click and money in the firm's account there are at least five distinct points at which a case can be counted, and published benchmarks use all of them.
| Denominator | Published value | Source and note |
|---|---|---|
| Ad click → lead | 5.45% (PI) | Foundry CRO / LocaliQ. A landing page rate, tabled beside lead-to-client rates. |
| Raw purchased lead → signed | 15–25 per 100 | Work Aged Leads. Denominator includes unscreened leads. |
| Qualified lead → signature | ~55% | Mass Tort Ad Agency. Leads already screened to tort criteria, so the rate is far higher. |
| Signature → survives verification + 30-day falloff | $3,850 median | Mass Tort Marketing Agency. Strictest definition located. |
| Retained after investigation | No published figure | Argued by practitioners to be the only meaningful med mal metric. Nobody publishes it. |
The clearest illustration is the pair at the extremes. Mass Tort Ad Agency publishes a blended cost per signed case of $69.99, derived transparently from 7 campaigns, $807,741 in Meta spend and 17,801 qualified leads over a rolling 30-day window. Mass Tort Marketing Agency publishes a median cost per signed retainer of $3,850, derived from roughly 140 firms and about $180M in annual spend.
Both are defensible. The first counts a signature on a lead that has already been screened against tort criteria. The second counts only claimants who signed, cleared medical record verification, and were still engaged with the firm 30 days later. The same publisher notes that counting raw signatures overstates performance by 15–28%. That is the gap, and it is a definitional one. Which claimants survive verification is itself governed by the litigation's qualification criteria, so a firm screening against the wrong criteria will see the two numbers diverge further still.
3Only two of five sources show their working
We fetched and read five published benchmark pages. Two disclose a sample and a method. Three state figures with no sourcing of any kind.
| Publisher | Discloses? | What is disclosed |
|---|---|---|
| Mass Tort Ad Agency | Yes | 7 campaigns, $807,741 Meta spend, 17,801 qualified leads, rolling 30-day window, stated qualified-lead definition |
| Mass Tort Marketing Agency | Yes | ~140 firms, ~$180M annual spend, 16 torts, interquartile ranges after outlier removal |
| Mohr Marketing | No | Formula given, but no sample, source or date range |
| Work Aged Leads | No | Stage-by-stage breakdown asserted from experience; no data source |
| Foundry CRO | No | Attributes to LocaliQ, Andava, Clio; no method for any of them |
Disclosure: one of the two sources that discloses methodology is our own. We have applied the same test to it as to everyone else, and we are naming it rather than quietly ranking ourselves first. You should weight it accordingly — and you should apply exactly this test to any figure we publish in future.
The absence of methodology is not a minor stylistic gap. Mohr Marketing's page states that roughly 70% of legal leads fail to reach the retainer stage, which implies a 30% conversion rate. The 14% average conversion figure widely attributed to the same publisher sits in tension with that. Without a stated sample or definition there is no way to reconcile the two, and no way for a reader to tell which — if either — applies to their firm.
4Tort mix alone explains an order of magnitude
Before definitions enter the picture, which torts a firm runs accounts for enormous variance. Any blended national average is averaging across that spread.
separates the cheapest and most expensive qualified lead in a single publisher's own consistently defined figures — $11 for Suboxone, $3,050 for Depo-Provera. A firm running one tort and a firm running the other will produce wildly different “benchmarks” while doing nothing differently.
Whitehardt qualified lead cost data, April 2026, as reported in trade coverage
This is why a single national average is close to useless for planning. It is also why per-tort figures and per-tort conversion rates are the only version of this data worth acting on. The same logic applies to practice area: published personal injury cost per lead runs from $159 to more than $1,000, against $82.27 for bankruptcy. Modelling a campaign on a blended figure rather than a per-tort one is the most common way firms misjudge what a campaign will actually cost.
5What practitioners actually report
Self-reported figures from people managing the accounts cluster tighter than published benchmarks — but they come with a warning attached from the practitioners themselves.
In a September 2026 r/LawFirmMarketing thread, an agency manager running ads for firms across roughly thirty markets reported cost per signed case around $1,600–$2,000 from Google Ads, with Local Services Ads materially higher. Another described sub-$2,300 medical malpractice signed cases and was immediately challenged as implausible. The challenge is the useful part:
“For med mal, the metric is not CPSC, but rather cost per case retained after investigation. You could sign as many disgruntled patients as you want for far less than that even, but they don't amount to anything the vast, vast majority of the time.”
r/LawFirmMarketing, September 2026 — user-reported
That is the sharpest statement of the denominator problem produced anywhere in this research, and it came from a Reddit comment rather than from any of the five published benchmark pages. No published benchmark we located uses that denominator.
The other recurring practitioner theme is scepticism about the exercise itself. Asked whether 31 signed cases over nine months on $8,000 a month was good — about $2,322 per case before salary — the most substantive reply advised against benchmarking against other firms at all, on the grounds that self-reported marketing numbers are distorted in both directions, and recommended tracking fee value by source instead — advice that lines up with measuring ad spend against signed retainers rather than against leads. Treat everything in this section as user-reported and unverified, because that is what it is.
6Check your own number against the right band
Enter your figures below. The tool shows which published bands your number falls inside — and, more importantly, what each of those bands was actually measuring.
Where does your number actually land?
Enter your own figures. Nothing is sent anywhere.
Against published 2026 bands
Landing inside a band does not mean you are performing well. It means your number is comparable to a figure someone published using that denominator. If your firm counts signatures and the band counts cases that survived verification, the comparison is invalid regardless of what this tool highlights.
If your firm counts signatures and the band you match counts cases that survived verification, you are not performing at that band — you are measuring a different event. Getting this right is the difference between a defensible signed retainer cost and a vanity number. It also depends on your intake team recording the same event every time, which is a process problem before it is a measurement one — our mass tort intake guide covers that. Getting it right feeds directly into how you evaluate exclusive lead pricing.
Get benchmarks with the denominator attached
We report cost per signed retainer on claimants who cleared verification and survived the 30-day falloff window, per tort, with the method stated. Ask us what your tort is actually running at.
Talk to us about your tort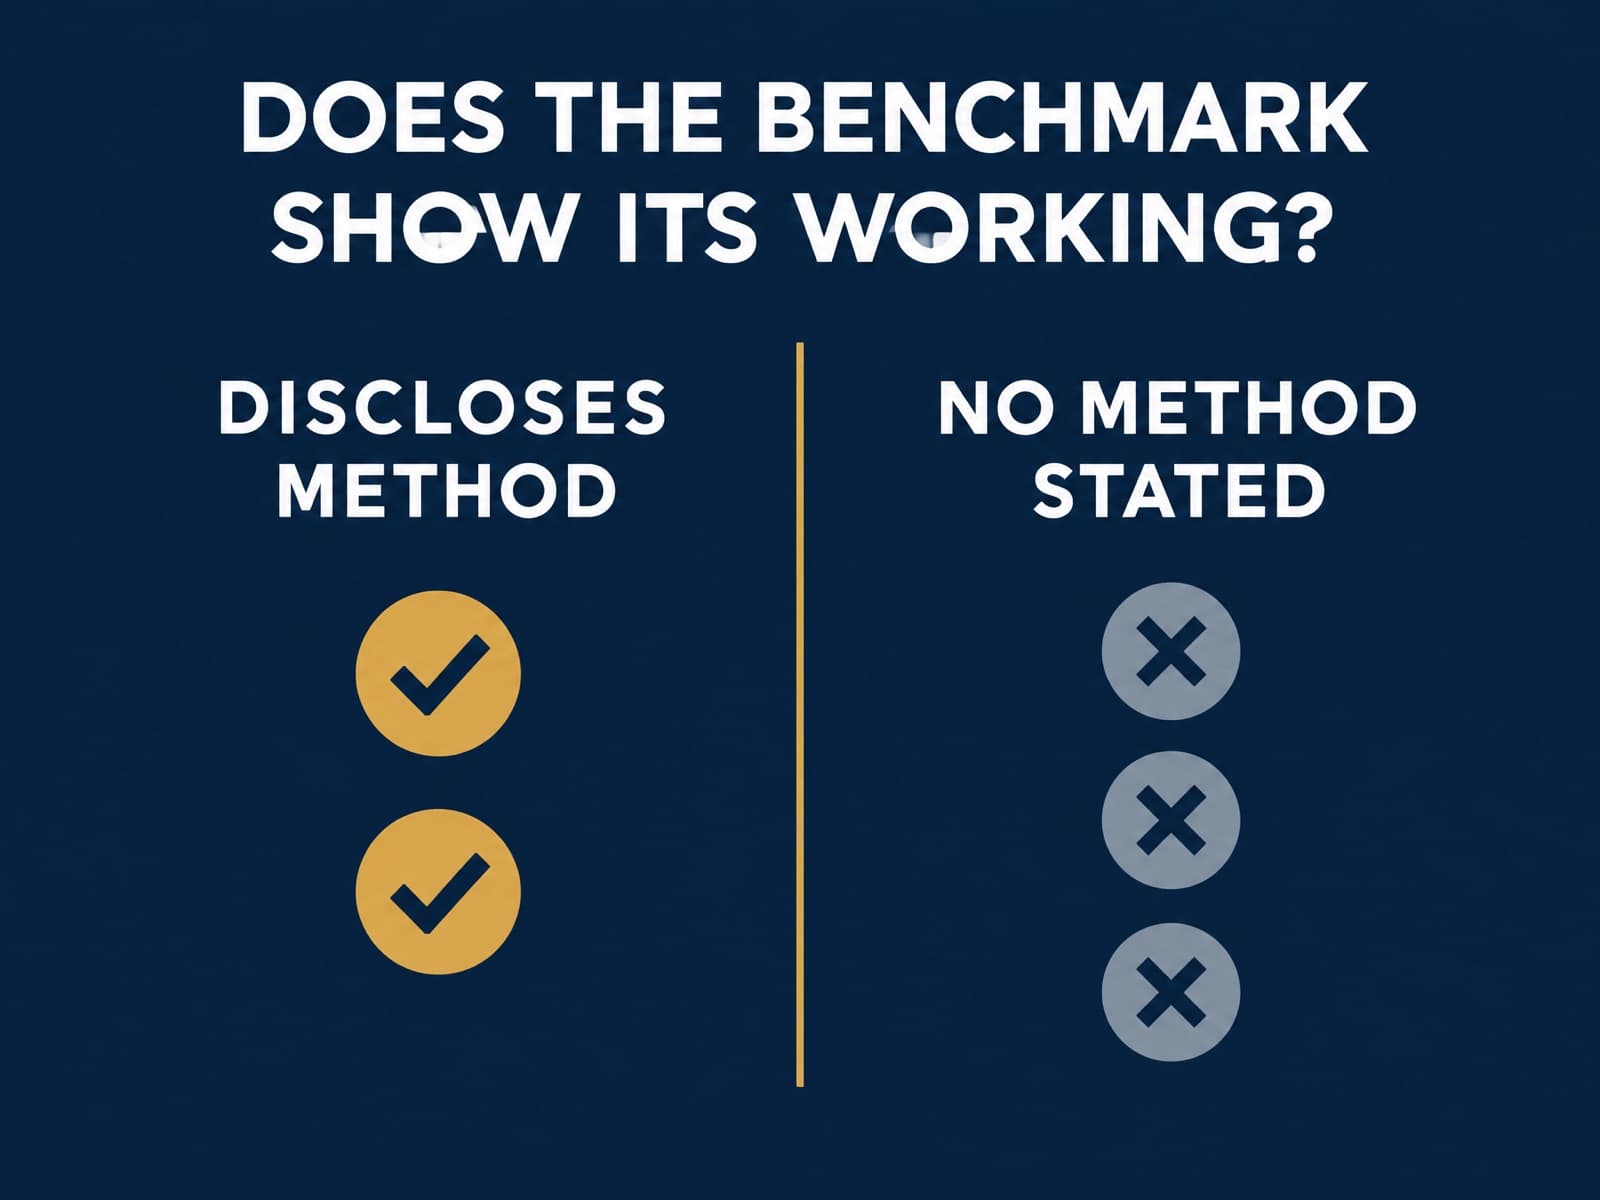
7Methodology
Research conducted September 20, 2026. Sixteen sources consulted, seven cited. Five published benchmark pages were fetched and read in full, and each was assessed for whether it discloses a sample size, data source, collection method or date range. Nine Reddit threads were retrieved in full, including comment sections, and are cited only as user-reported practitioner signal.
All published benchmark figures cited are current-year. Where a figure is user-reported it is labelled as such in the text and excluded from the reconciliation table. Three claims were dropped entirely: a widely repeated 14% average conversion rate with no disclosed sample, second-hand advertising spend attributed to a national firm, and a blended figure whose source page could not be located to verify its definition.
Competing interest. Mass Tort Marketing Agency publishes this article and also publishes one of the five benchmark sources assessed. That source is identified by name wherever it appears, and is subjected to the same methodology test as the others. Readers should discount accordingly.
Next scheduled update: December 2026, or sooner if any assessed publisher revises its figures or discloses a methodology.
Frequently asked questions
Because at least four different denominators are published under the same phrase. A “signed case” can mean a signature on an advertising lead, a retainer from a raw purchased lead, a retainer that has cleared medical record verification and a 30-day falloff window, or a case retained after investigation. Those are different events occurring at different points in the funnel, and the published 2026 figures attached to them span $69.99 to $11,500.
That works out to roughly $2,322 per signed case before staff cost. It sits inside the $2,000–$5,000 urban personal injury band Mohr Marketing publishes, and above the $1,600–$2,000 Google Ads figure practitioners report on Reddit. But the number is meaningless without average fee per case: the same result is strong for medical malpractice and weak for high-volume motor vehicle work.
It depends entirely on what you divide by. Against raw purchased leads, published figures suggest 15–25%. Against leads already screened to tort criteria, one publisher reports about 55%. Against ad clicks, 5.45% is published for personal injury. All three appear in print described as a “conversion rate”, and they are not comparable to one another.
Two of the five examined. Mass Tort Ad Agency discloses 7 campaigns, $807,741 in Meta spend and 17,801 qualified leads over a rolling 30-day window. Mass Tort Marketing Agency discloses roughly 140 firms and about $180M in annual spend, reported as interquartile ranges after outlier removal. Mohr Marketing, Work Aged Leads and Foundry CRO disclose no sample size, source or date range.
Practitioners are sceptical, and the scepticism is earned. The most substantive advice in the clearest benchmarking thread was to avoid benchmarking against other firms entirely, on the grounds that self-reported marketing numbers are distorted in both directions. Benchmarks are most useful for testing whether your own definitions are sound — not for grading your performance against strangers.
Tort mix alone produces order-of-magnitude differences before definitions enter the picture. Whitehardt’s April 2026 qualified lead costs run from $11 for Suboxone to $3,050 for Depo-Provera — a 277x spread inside a single publisher’s own consistently defined figures. Any blended national average is averaging across that.
The one that matches the event you can actually bank. If cases routinely fail after signature — as practitioners argue is normal in medical malpractice — then cost per signature flatters your reporting, and cost per case retained after investigation is the figure that predicts revenue. Notably, no published benchmark we found uses that denominator at all. Pick one, write the definition down, and apply it consistently.
It is widely published, including a stage-by-stage breakdown attributing 25–35% to initial contact failure and 15–25% to exposure screening. No source discloses a sample size or collection method for those figures, so they are best treated as practitioner consensus rather than measured data.
Sources
- 1. Mass Tort Ad Agency. “Mass Tort Cost Per Lead Benchmarks.” Reviewed September 6, 2026. masstortadagency.com. Accessed September 20, 2026.
- 2. Mohr Marketing. “Cost Per Signed Case: The 2026 Benchmarking Guide for Law Firms.” mohrmktg.com. Accessed September 20, 2026.
- 3. Mass Tort Marketing Agency. “Cost Per Signed Retainer 2026: Mass Tort & PI Benchmarks.” masstortmarketingagency.com. Publisher of this article.
- 4. Work Aged Leads. “How to Work Mass Tort Leads: First Contact to Signed Retainer (2026).” workagedleads.com. Accessed September 20, 2026.
- 5. Foundry CRO. “Legal Marketing Benchmarks by Practice Area.” foundrycro.com. Accessed September 20, 2026.
- 6. Whitehardt qualified lead cost data, April 2026, as reported by Adduro. adduro.io. Accessed September 20, 2026.
- 7. Reddit threads r/Legalmarketing “Benchmarking Cost-Per-Lead and Cost-Per-Signed-Case for PI” (July 2026), r/LawFirmMarketing “Personal Injury Cost Per Case” (September 2026) and “Is 31 Signed Cases in 9 Months Good on an $8k/Month Ad Budget?” (July 2026). Cited as user-reported practitioner signal only.
Last updated September 20, 2026. Figures attributed to third-party publishers are quoted as published and were accurate at the date accessed.